Trading Software

with 30 years of experience built in !


     USERS LOGIN PAGE


 READ LAST WEEK'S DELINEATOR JOURNAL HERE


The Delineator


Watch in near real time


Click to learn about The Delineator


DID YOUR SOFTWARE PREDICT THE DECLINE?


The Accumulator


watch near real time


`Click to learn about The Accumulator


home

delineator

accumulator

contact


e quantus exactus


"A nation that is afraid to let its people judge the truth and falsehood in an open market is a nation that is afraid of its people." -- JFK

copyright 2010, HCMI, all rights reserved.

The Delineator and Accumulator programs and all material shown on this website is published by HCMI and may not be reproduced, disseminated, or distributed, in part or in whole, by any means, outside of the recipient's organization without express written authorization from HCMI. It is a violation of federal copyright law to reproduce all or part of this publication or its contents by any means. This material does not constitute a solicitation for the purchase or sale of any securities or investments. The opinions expressed herein are based on publicly available information and are considered reliable. However, HCMI makes NO WARRANTIES OR REPRESENTATIONS OF ANY SORT with respect to this report. Any person using this material does so solely at their own risk and HCMI and/or its employees shall be under no liability whatsoever in any respect thereof.


sits: [an error occurred while processing this directive]
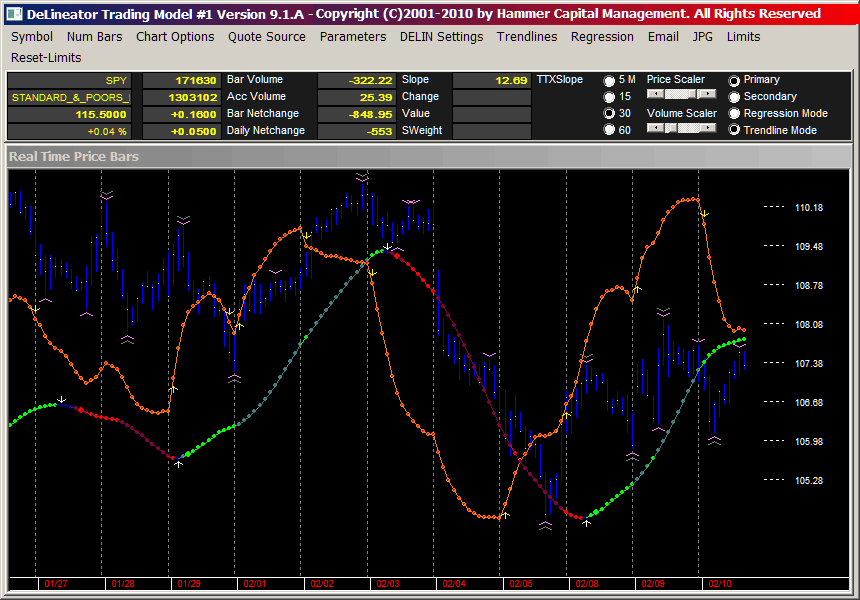
This is the Primary Delineator.  It's red because its current direction is in confirmation with the direction of the Secondary. These are the price bars shown on a 30 minute timeframe.  Those are single and double chevron downs which identify resistance levels. White arrows are SLOPE CHANGES, not buy or sell signals.  The green dots indicate the current direction of the Primary is confirmed by the direction of the Secondary.
When the Primary changes slope, a new cycle is identified.  Any price moves opposed to this direction will reverse and follow the direction of the Primary based upon the level of signal weight. This is the KEY part of the software.  These 4 data points allow you to predict the motion of the Primary and hence the direction price will resolve. TTXSlope is the time (in bars) to the next slope change.  Knowing a slope change will occur allows you to identify price reversals and sell into highs and buy into lows. This section allows you to switch between time frames and modes. You'll learn about this line later if you sign up. These bars show total volume traded at prices over the number of bars shown on the display.  When used in combination with the chevrons, it provides accurate target identification for trading.