Trading Software
with 30 years of experience built in !
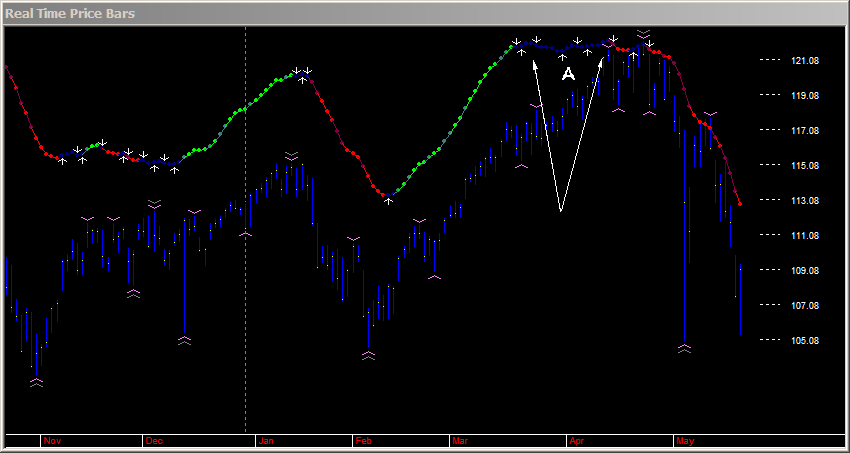
Here's how the Delineator called the recent decline from the highs in April 2010
|
The Delineator makes very specific trend identifications shown in the graphic above. We all recognize red as down and green as up cycles. But when the Delineator is BLUE, there are no trends and any further advance in price from the previous trend is unsustainable. Look at the period identified in the graphic as A. Notice how price continues to rise from March 19th, (when the Delineator called an end to that up cycle), yet the Delineator remained blue? The Delineator was telling you to sell into any further price rise, that these levels were unsustainable. This is fully documented in the Archive section over that time period. The March 2009 low was also identified in the same manner and is in the Archive section as well. The Delineator is a true leading indicator that really works. It can be used for inter-day trading, portfolio management, options and other strategies. Price follows the direction of the Delineator. See for yourself. Sign up for access to the realtime Delineator Journal. Timing does matter.
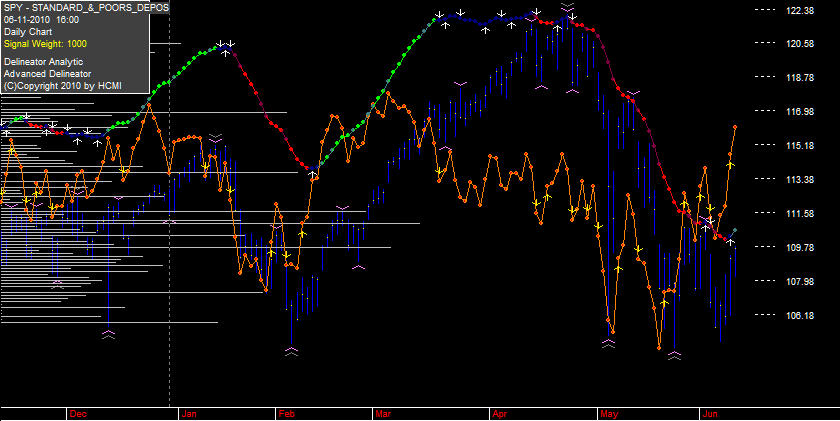
Beginning on May 27th, 2010 the Secondary began showing "positive divergence" into the lows in June.
See how the orange line moves higher while the price action moves lower? This is 'positive divergence' and is a pattern that allows users to buy into lows to position for a major trend change. This trend change confirmed on June 11th 2010. |
visits: [an error occurred while processing this directive]