The Delineator Journal


Primary    Secondary    Long Signal    Short signal

Archive    Manual    About


The Delineator Analytic - Components
The Delineator
Figure 2-1 The Delineator Analytic

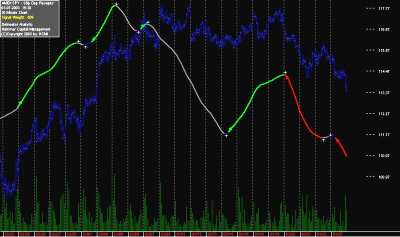
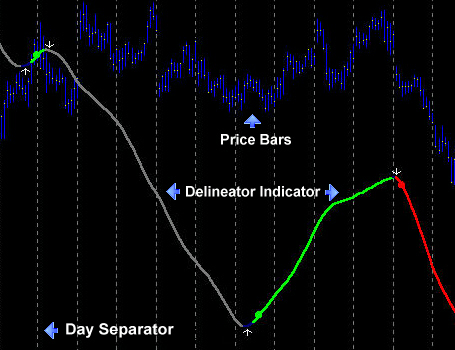
The Delineator itself is represented by a line overlaid against the particular ETF price chart (SPY and QQQ):
Price and Delineator
Figure 2-2

The Delineator is based in 30 minute time frames. Every price bar and Delineator line segment on the chart represents the activity of that 30 minute time period. Each price bar represents the high and low and closing price (white dot on price bar) for that time period.

Each dashed vertical grey line on the chart separates a full trading day. These separator lines are drawn at the close of each trading session.

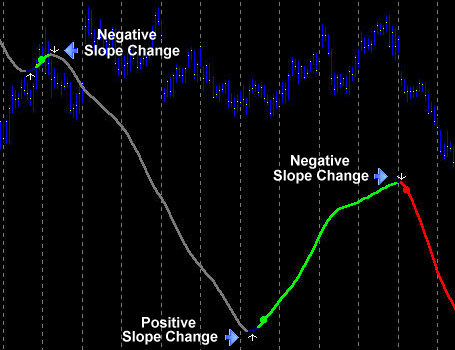
At its core, the Delineator indicator either moves upward or downward. Changes in slope are represented with a slope change arrow either above (for negative slope changes) or below (for positive slope changes) the Delineator line. Slope changes are either positive or negative.
Slope Changes
Figure 2-3


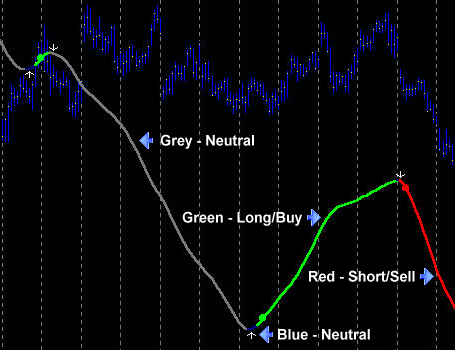
The Delineator has four colors:
  1. Blue - The indicator has changed slope but has not generated a signal. Wait.
  2. Grey- The indicator is not confirmed by the secondary indicator. Do Nothing.
  3. Red - The Indicator is in a Short/Sell mode and is confirmed.
  4. Green- The Indicator is in a Long/Buy mode and is confirmed.
Components
Figure 2-4

While the secondary indicator is not graphed on the chart, it is taken into account with the color-coding components of the Delineator chart.
Miscellaneous Chart Components

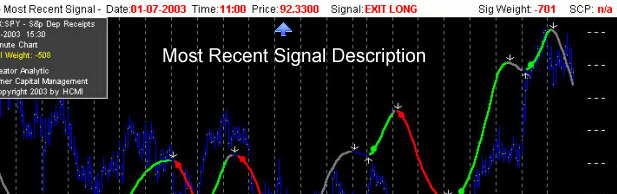
Most Recent Signal Description:
Status
Figure 2-5


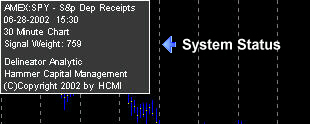
System Status:
Status
Figure 2-6

In the upper left hand corner of the chart is the System Status. This displays:
  1. The symbol and name of the ETF being tracked.
  2. The Date and Time the chart was generated.
  3. The number of minutes each bar in the chart represents.
  4. The current Signal Weight.
  5. Title and Copyright Notice.


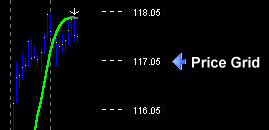
Price Grid:
Price Grid
Figure 2-7

To the right of each chart is the Price Grid. This is a vertical grid which shows the price of the ETF being tracked over the range of the chart.


ETF Volume:
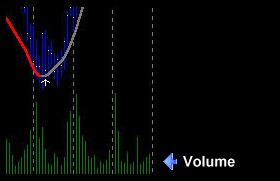
Volume
Figure 2-8

Below the Price bars and Delineator indicator is Volume. This represents the accumulated volume in each individual price/time bar.


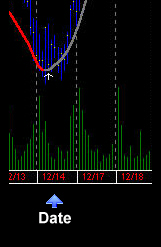
Time Grid:
{short description of image}
Figure 2-9

On the bottom of each chart is the Time Grid. This is a horizontal grid which shows the time or date of the ETF being tracked over the range of the chart.


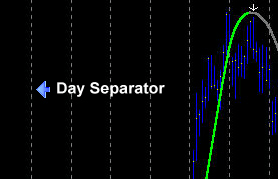
Day Separators:
{short description of image}
Figure 2-10

Each dashed vertical grey line on the chart separates a full trading day. These separator lines are drawn at the close of each trading session.


 visits: [an error occurred while processing this directive]